Server
Requirements
- Projektor server .jar file from releases page
- Java 17+ for Projektor server v5.x.x
- Java 11+ for Projektor server v4.x.x
- Postgres
- (optional) S3-compatible object store for storing attachments
Changelog
Startup
Set up the environment variables listed below to configure the features you want to use. The bare minimum set of configuration to start Projektor is the database URL, username, and password.
Then to start the server, simply run java -jar projektor-server-<version>.jar
Java 17 troubleshooting
If you encounter InaccessibleObjectException exceptions when running with Java 17, add params
--add-opens=java.base/sun.net.www.protocol.https=ALL-UNNAMED --add-opens=java.base/java.net=ALL-UNNAMED to the java execution:
java --add-opens=java.base/sun.net.www.protocol.https=ALL-UNNAMED --add-opens=java.base/java.net=ALL-UNNAMED -jar projektor-server-<version>.jar
The library that Projektor users for posting comments to GitHub PRs contains reflection code that can be impacted by running Java 17+.
Database configuration
Projektor stores the parsed test results in a Postgres database. To configure which database Projektor connects to, please set the following environment variables:
DB_USERNAME=<username>
DB_PASSWORD=<password>
DB_URL=<url>
For example, to connect to a local database:
DB_USERNAME=testuser
DB_PASSWORD=testpass
DB_URL=jdbc:postgresql://localhost:5432/projektordb
Schema
You can optionally set the database schema to use by setting the DB_SCHEMA environment variable.
If that is not set, the server will default to the public schema.
Attachment object store configuration
If you want to support adding attachments (like Cypress screenshots) to your Projektor reports, configure an S3-compatible object store by setting the following environment variables:
ATTACHMENT_URL=<url>
ATTACHMENT_BUCKET_NAME=<bucket>
ATTACHMENT_ACCESS_KEY=<access_key>
ATTACHMENT_SECRET_KEY=<secret_key>
There are also a couple more optional parameters you can specify:
ATTACHMENT_AUTO_CREATE_BUCKET=< true to automatically create the bucket on startup if it does not exist >
ATTACHMENT_MAX_SIZE_MB=< attachments above this max size in MB will be rejected >
Metrics
The Projektor server supports publishing metrics via Micrometer to InfluxDB. InfluxDB metrics are easy to graph and visualize using tools such as Grafana.
Metrics configuration
Environment variables to set to configure the metrics:
METRICS_INFLUXDB_ENABLED=< true to enable metrics collection and publishing >
METRICS_INFLUXDB_URI=< URI of the InfluxDB server >
METRICS_INFLUXDB_DB_NAME=< name of the InfluxDB database to store metrics >
METRICS_INFLUXDB_AUTO_CREATE_DB=< whether to automatically create the InfluxDB database if it does not already exist >
METRICS_INFLUXDB_USERNAME=< optional - username for the InfluxDB server if it has auth enabled >
METRICS_INFLUXDB_PASSWORD=< optional - password for the InfluxDB server if it has auth enabled >
METRICS_INFLUXDB_INTERVAL=< optional - how often to publish metrics - defaults to every 10 seconds >
METRICS_INFLUXDB_ENV=< optional - environment tag to add to all metrics >
Published metrics
The Projektor server is built with ktor and publishes the default ktor server metrics as well as a few custom metrics:
- ktor default metrics
results_process_start- when results processing startsresults_process_success- when results sent to the server are successfully processedresults_parse_failure- when there is an error parsing the results sent to the serverresults_process_failure- when there is an error processing results (any error besides a parse error)coverage_process_start- when processing a code coverage report startscoverage_process_success- when a code coverage report sent to the server is successfully processedcoverage_parse_failure- when there is an error parsing a code coverage report sent to the servercoverage_process_failure- when there is an error processing a code coverage report (any error besides a parse error)pull_request_comment_success- when the server successfully comments on a pull requestpull_request_comment_failure- when there is a failure commenting a pull request
The list of metrics is also in the server codebase in MetricsService.kt
Database cleanup
To keep the database size manageable, Projektor has a scheduled job that runs once a day and cleans up test runs and attachments that are older than a specified number of days:
MAX_REPORT_AGE_DAYS=<test runs created more than X days will be deleted>
MAX_ATTACHMENT_AGE_DAYS<attachments created more than X days ago will be deleted>
CLEANUP_DRY_RUN<optional - set to true to just log the number of reports that would be cleaned up and not actually delete them>
Messages
It can be helpful to display a message to all users in the Projektor UI if you want to notify them of upcoming changes, etc. To do that, set this environment variable:
GLOBAL_MESSAGES=<Messages to display to all users in the Projektor UI. If you want to show multiple messages, use a pipe | to separate them. >
GitHub links
Projektor can link directly to files in the GitHub UI, for example linking to uncovered or partial lines on the code coverage page. To enable that linking capability, you’ll need to set the base URL for GitHub (either public GitHub or a GitHub enterprise instance):
GITHUB_BASE_URL=<base URL of the GitHub instance, for example https://github.com for public GitHub>
GitHub pull request comments
Projektor can comment on pull requests with direct links to the Projektor report, test pass/fail counts, code coverage stats, etc. To help configure that capability, set the following environment variables:
SERVER_BASE_URL=<base URL of the Projektor server>
GITHUB_API_URL=<base URL of the GitHub API, either the public GitHub API or a GitHub Enterprise instance. For example, for public GitHub use https://api.github.com
GITHUB_APP_ID=<GitHub app ID for the Projektor GitHub app instance>
GITHUB_PRIVATE_KEY<Base64-encoded private key for the Projektor GitHub app>
Troubleshooting
As with any software app, sometimes things go wrong when the Projektor server is processing incoming test results and coverage reports. Sometimes these problems are related to the incoming data (malformed test results .xml files, etc.), issues reaching the database, etc.
To help diagnose what exactly happened when processing incoming results fails,
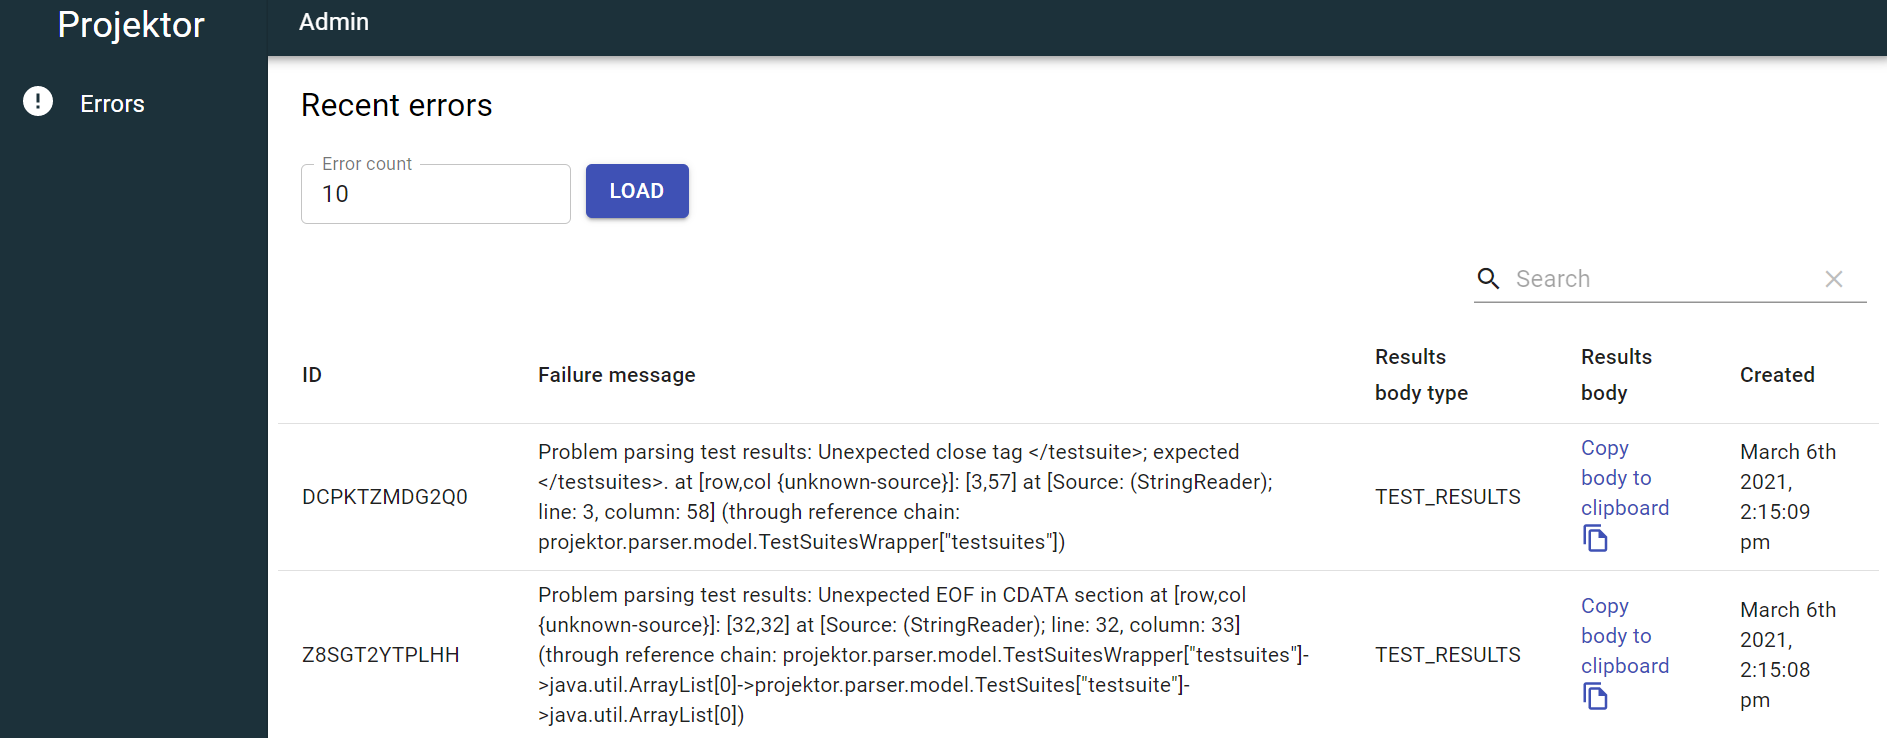
Projektor has an admin screen at /admin where you can view the most recent failures:

By default the screen will show the last 10 failures, but you can specify to load more failures as needed.
In addition to the failure message, sometimes it is helpful to look at the raw incoming results body to help identify what went wrong. As these results bodies are huge it’s often more helpful to view them in an IDE where you can auto-format the payload for easier viewing. To do that, you can click the link to copy the results body to your clipboard then paste it into your favorite editor for easier formatting.
